Prologue
What’s Good About the GOP Tax Plan
What’s Bad About the GOP Tax Plan
Omissions
Conclusion
Sources
The Blueprint will redistribute about two percentage points of national income share to the more wealthy households.
The Blueprint provides for large changes in top tax rates from current levels. This table compares the top marginal rates for different kinds of income.
Income type
|
Current law top marginal rate
|
GOP Blueprint top marginal rate
|
Main beneficiary of Blueprint
|
Individual ordinary income
|
39.6%
|
33%
|
One Percent
|
Investment income (interest, dividends, realized gains)
|
25% (approx.)
|
16.5%
|
Ten Percent
|
Small businesses (a.k.a. passthroughs: sole proprietorships, S corporations, partnerships)
|
39.6%
|
25%
|
Ten Percent
|
Large businesses (C corporations)
|
35%
|
20%
|
Ten Percent
|
The Blueprint states (on page 5) admirable goals for simplification, fairness, economic growth, stimulation of employment, and sensitivity of the IRS Internal Revenue Service to taxpayer concerns. It emphasizes “And it [the Blueprint] is the beginning of our conversation about how to fix our broken tax code.”
The Blueprint includes some genuine simplifications, including repeal of AMT Alternative Minimum Tax, simple calculation of investment income subject to tax, consolidation of several common deductions and credits, and other improvements.
The Blueprint claims, with little evidence, that tax reductions produce economic growth. To justify tax cuts for businesses and the more wealthy households, the Blueprint relies solely on a single economist whose research findings vary widely from the consensus of his colleagues.
The Blueprint preserves the capital gains (profit on increase in value of property) loophole. It preserves the mortgage interest deduction.
Also, the Blueprint ignores the national crisis of disparity of incomes and the extensive research showing that tax cuts for the more wealthy households shift national income to the more wealthy households, exacerbating the disparity.
The Blueprint includes the BAT Border Adjustment Tax regime, combining an export subsidy and an import tax. BAT, a regressive tax regime, weighs more heavily on the less wealthy.
I can’t know with certainty the internal motives of Paul Ryan and other GOP members of Congress, but if they want to shift after-tax income from the less wealthy to the more wealthy, then this Blueprint shows a way.
Here are some things to keep in mind, as you read this article.
According to Piketty, Saez & Stantcheva (2014), CEO pay levels go up when top tax rates are lowered. “Top tax rate cuts are associated with top one percent pretax income shares increases but not higher economic growth.”
According to Gale & Samwick (2015), “The argument that income tax cuts raise growth is repeated so often that it is sometimes taken as gospel. However, theory, evidence, and simulation studies tell a different and more complicated story.”
According to Lansing & Markowitz (2016), “From 1977 to 2007 three-fourths of the income growth in the U.S. economy went to the top 10% of households.”
WHAT’S GOOD ABOUT THE GOP TAX PLAN
The Blueprint
Mr. Paul Ryan, Speaker of the House of Representatives, organized a Task Force to construct a “Blueprint” for reforming federal taxation. The Task Force Report, the “Blueprint”, was published June 24, 2016.
The Task Force emphasizes “And it [the Blueprint] is the beginning of our conversation about how to fix our broken tax code.” The GOP seeks discussion, modification and agreement.
Goals and Principles
The Blueprint states (on page 5) admirable goals for simplification, fairness, economic growth, growth of employment, and sensitivity of the IRS Internal Revenue Service to taxpayer concerns.
Also, in their report, the Task Force enumerates the principles that guided their consideration of policies and provisions. They asked two questions about each policy or provision. The first question, “Will this policy reform grow our economy?”, keeps the focus on economic growth. The second question, “Is it worth raising taxes on everyone else to include this provision?”, prevents loopholes. A loophole results when an exception favors some special interest with lower or delayed effective tax, which is quite like taxing everyone else more.
Simplifications
The Blueprint includes some genuine simplifications. It repeals the AMT Alternative Minimum Tax which requires many filers to calculate their tax according to two different rules.
It calculates investment income subject to tax as simply half of interest income, dividends and capital gains, replacing the incomprehensible current calculation.
It consolidates several common deductions and credits. It replaces the current array of education deductions and credits with a single calculation (unspecified). It raises the standard deduction and child & dependent deductions, eliminating itemized deductions for many filers.
IRS Customer Focus
The Blueprint calls for reorganization of the IRS to focus their efforts on “customer service”.
Fraud Prevention
It corrects the process for awarding EITC Earned Income Tax Credit to fix some forms of fraud.
WHAT’S BAD ABOUT THE GOP TAX PLAN
Redistribution of Federal Revenues
The Blueprint will increase the aggregate after-tax household income share of the One Percent by about 2% of total national household income. Given total adjustable gross income of about $9.1t, this is about $150b for the One Percent, far exceeding the benefits for other income levels.
Beneficiaries of Reduction in Top Marginal Tax Rates
The Blueprint provides for large changes in tax rates from current levels. This table compares the top marginal rates for different kinds of income.
Income type
|
Current law top marginal rate
|
GOP Blueprint top marginal rate
|
Main beneficiary of Blueprint
|
Individual ordinary income
|
39.6%
|
33%
|
One Percent
|
Investment income (interest, dividends, realized gains)
|
25% (approx.)
|
16.5%
|
Ten Percent
|
Small businesses (a.k.a. passthroughs: sole proprietorships, S corporations, partnerships)
|
39.6%
|
25%
|
Ten Percent
|
Large businesses (C corporations)
|
35%
|
20%
|
Ten Percent
|
For the owners of corporations (the shareholders), and owners of larger “small” businesses, and for the more wealthy households taxed at top rates, the business and investment tax cuts are big cuts amounting to 14% of their taxable business and investment income. The Ten Percent (household incomes greater than roughly $150,000 annually) get nearly all business and investment income. Tax cuts for businesses benefit the incomes of the owners much more than they benefit the incomes of the staff. The One Percent (household incomes greater than roughly $500,000 annually) are taxed at top rates. Thus, the people who benefit most notably from these tax cuts are the more wealthy Ten Percent of households.
Consider how these changes in top rates affect the most wealthy One Percent of households. Of total national household income, the One Percent collect a share of about 20% to 25%. About one-third of their income is ordinary income, about one-third is investment income, and about one-third is passthroughs. For illustration, let’s think of each of these thirds as about 7% of national household income. With Blueprint, the tax rate on ordinary income will drop 7 percentage points, increasing their aggregate after-tax income by 0.5% of all national household income. Similarly, the lower tax on investment income gives them 0.6%, and the lower tax on small businesses gives them an additional 1.0%. Add these up, and we see that the Blueprint will increase the aggregate after-tax household income share of the One Percent by about 2% of total national household income. This is money that would otherwise be US government revenues. Were it paid instead to the least wealthy Fifty Percent, then it would be called "redistribution".
Windfall Retroactive Tax Reduction on Foreign Income
Under current law, companies doing business in foreign countries are taxed in the U.S. on world-wide operations. Companies that wish to bring foreign earnings to the U.S. (termed “repatriation” for “American” companies) will be taxed at U.S. rates in effect when the income was earned, less the amounts of foreign taxes paid. Many companies in this situation have found it more profitable to invest the money in other countries, rather than transferring it to the U.S. The Blueprint provides for one-time taxation of accumulated foreign earnings at 8.75% (a surprisingly precise number) on cash and 3.5% otherwise, payable over an eight-year period. This is an astonishing loophole granting, in effect, a retroactive tax windfall to the companies that can profit from it. This is a huge giveaway.
The Blueprint says the money will be used to create jobs and grow their U.S. operations, but the Blueprint contains no process to assure that any person will be hired. Nor does it assure expansion of U.S. business operations. Indeed, having taken advantage of this one-time tax dodge, the benefiting corporation could send the money to some foreign country to expand operations that appear more profitable than projects available to them in the U.S. Or the company could pay it to their CEO, with which compensation the CEO might buy a nice villa in the south of France.
Double Taxation
The Task Force Report discusses “double taxation” at length. The government taxes a large corporation, which then pays dividends from its after-tax income, and government taxes the dividends received by the owners. The Task Force says the lower taxes on investment income and corporations will mitigate the double taxation. An alternate way to mitigate double taxation, apparently not considered by the Task Force, would be deducting dividend payments from corporate income, as is done with interest payments, and taxing the receiving owner. Under the Blueprint, an owner can sustain a 20% tax rate via the corporation earning income, then shelter income indefinitely by leaving it invested in a corporation.
BAT Border Adjustment Tax
On the BAT Border Adjustment Tax, economists working with the Federal Reserve Bank of New York expect that “Both firms and households will be faced with higher prices for imports and domestically produced goods alike."
Overreliance on Outlier Economics
The Task Force Report depends heavily for economic justification on the work of Mr. Kevin Hassett. On Hassett they rely to explain why tax cuts for businesses increase employment and wages. Moore & Wallner assert that “Kevin Hassett has assembled solid evidence showing that business rate reductions primarily benefit the working class through higher wages.” I looked among the documents cited in the Ryan Tax Plan, including those by Kevin Hassett. The evidence is hard to find and hardly conclusive, given the numerous contrary findings by other economists. Even if we grant Hassett’s findings some validity, the incomes of the least wealthy Fifty Percent have not participated in national economic growth since 1980, implying that economic growth hasn’t visited half the population in the wake of the substantial tax cuts that occurred since 1980. If tax cuts didn’t make them prosperous before, then why will tax cuts make them prosperous now?
Gale & Samwick (2015) reviewed numerous studies by CBO Congressional Budget Office, U.S. Treasury, the Congressional JCT Joint Committee on Taxation, and a number of academic economists. They consider empirical evidence from events such as the Reagan tax reform, the Clinton tax increases, the G.W. Bush tax cuts, and the Obama “sequester” and health-care tax increases. They also use mathematically modeled scenarios. Per these researchers, 80% to 95% of the benefit of a reduction in business ("capital") income tax goes to the owners of the business, and the rest goes to the workers ("labor"). That is, for each dollar of ostensible “job creation”, the owners of the business get nine dollars. New jobs and increased pay are incidental, indirect effects, when they occur at all.
As further economic justification, the Blueprint cites Hassett to assert that tax cuts stimulate economic growth. The preponderance of research by other economists shows no significant effect, except when budget deficits finance the cut, in which case the cuts produce long-term economic decline, per Gale & Samwick (2015). They also comment “U.S. historical data show huge shifts in taxes with virtually no observable shift in growth rates.” Piketty, Saez & Stantcheva (2014) write that CEO pay levels go up when top tax rates are lowered. “Top tax rate cuts are associated with top one percent pretax income shares increases but not higher economic growth.”
Misapprehending the Benefits of Growth
The Blueprint is intent, ostensibly, on “growth”, which isn’t clearly defined. Usually, they refer to growth of GDP per capita. Growth of GDP per capita is almost exactly mathematically the same as growth of GDP. GDP per capita is total GDP divided by population. This average seems, superficially, very fair and even. However, GDP and GDP per capita aren’t distributed fairly and evenly. The Ten Percent collect three-fourths of the growth of incomes. The least wealthy Fifty Percent of households have experienced almost zero real (adjusted for inflation) growth of incomes since 1980. The 10% of households with the highest incomes, the top Ten Percent, have about 50% of the national income. If the total national GDP per capita increases by 2% and GDP10 the GDP per capita of the top Ten Percent increases by 5%, then GDP90 the GDP per capita of the other Ninety Percent must decrease by 1%.
(Incomes are about 80% to 90% of GDP. While there are some differences, GDP and incomes are roughly equivalent in their year-to-year changes. We can think of GDP10 as the portion of GDP associated with the incomes of the top Ten Percent, and GDP90 as the portion of GDP associated with the incomes of the less wealthy Ninety Percent.)
In some places, the Blueprint refers to growth in size of paychecks, to productivity growth, and to increased employment. If the Task Force's intent is to generate growth, then one would expect they could trace their ideas to the kind of growth they expect to result, but they don’t. If generating growth isn’t their intent, then there’s no need or perhaps there’s no possibility to trace the causes and effects.
Regressive Taxation of Consumption
The Task Force points out that shifting toward a consumption tax, by the combination of reducing taxes on savings and investment and the BAT, will contribute to producing growth. Indeed, Gale & Samwick (2015) say in their conclusion that two of the many studies they surveyed found that corporate and personal income taxes burden GDP growth more than property, value added, or sales taxes. But since the Ten Percent save substantial parts of their income, and the One Percent save the majority of their income, and the Ninety Percent save nearly none of theirs, a consumption tax will fall most heavily on the Ninety Percent. With the Ten Percent taking the majority of the growth, this change to BAT amounts to a transfer of incomes from the Ninety Percent to the Ten Percent. If BAT is adopted, then Congress should adopt a uniform refundable tax credit for each individual aggregating, say, 2% of national income, financed perhaps by top marginal rates of about 40%.
Mortgage Interest Deduction
The Task Force chooses to continue the Mortgage Interest Deduction, which favors the more wealthy households and the banks which receive the mortgage interest. This old loophole needs fixing. The deduction also tends to increase the cost of housing by enabling buyers to bid a little higher than they otherwise could. The Mortgage Interest Deduction contributes significantly to residential real estate booms and busts, inflates the cost of housing, and provides interest income to banks that lend money on mortgages. If the government wishes to encourage privately owned houses, then it should provide direct subsidies to builders of residences, to the suppliers of housing, not the buyers and not the bankers.
Capital Gains
The Blueprint preserves the capital gains loophole, lightly taxing income in this form. The favorable treatment of capital gains is an old loophole, quite eligible for fixing. Capital gains are the difference between the current value and the purchase price of property (principally stock options, stocks, bonds, real estate). The Ten Percent own nearly all property, by value, so the Ninety Percent get little benefit. A suitable reform would assess the change in value each year and tax the unrealized and realized gains at the same tax rates that apply to wages. Some caps or exemptions or phase-outs might apply for primary residences and elderly taxpayers relying on investment income.
R&D Research and Development
The Blueprint provides for a R&D Research and Development credit for businesses. R&D is an ordinary business expense and there is no good reason to provide this old loophole. The loophole is subject to abuse when businesses book unrelated expenses to the research department. Businesses conduct research to generate profits, typically within five years or less. With few exceptions, they ignore the basic research that enables great scientific advances. If the government chooses to encourage R&D, then it should make grants to the National Institutes of Health, the National Aeronautics and Space Administration, other government research organizations and universities, with the proviso that intellectual property developed will immediately enter the public domain.
Propaganda
The entire Task Force Report is burdened with excessive propaganda. Translating the unnecessarily pejorative and eulogistic phrasing into useful thoughts is extremely tedious. For example, the Blueprint conflates “job creator” and “business”. Also, “penalty” and “tax”. Taxes are the price of civilization. Taxes aren’t penalties. Mr. Ryan should object to describing them as such.
Joining an International Race to the Bottom
The Blueprint makes many references to the taxing policies of other countries and alleges that taxes are higher in the U.S. than in other countries, so we should allow decisions in foreign capitals to steer U.S. laws, and we should reduce U.S. income tax rates to be lower than theirs. This race to the bottom will, the Blueprint says, make the U.S. more competitive. The argument is stated without evidence, the statements about foreign countries are cherry-picked, and on this score, the Blueprint simply isn’t convincing.
False Simplification
The Blueprint repeatedly heralds the “postcard” tax form as a great simplification, but it’s a false simplification. It doesn’t simplify. It hides complexity, merely providing a place to write the last lines of tedious calculations done elsewhere. For instance, line 10 says “Subtract earned income credit” without any process for computing it. That computing will occur on an attached page, of course. Anyone with income and deductions more complex than wages received from a single employer will have to attach a set of forms much like the existing attachments to form 1040.
The 3 tax brackets is another false simplification. Tax brackets aren’t complex in any significant way. People simply read them from a table, if their accountant or computer doesn’t do it for them. This “simplification” is a way for politicians to pretend they’ve done something useful, and that’s all.
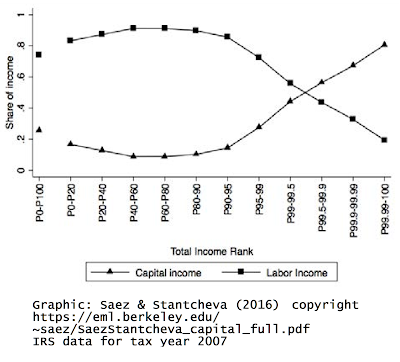
Optimal Taxation
The GOP Tax Plan should, but doesn’t, increase the top marginal tax rates. Saez & Stantcheva (Sep 2016) identified an optimal maximum income tax rate, for capital (investment and business) income of about 60% and for labor (ordinary) income of about 50%, promoting broad dispersion of income with ample incentive for work and investment. Lower rates promote concentration of income in the more wealthy subsets of the population.
Principles
In addition to the two questions that guided the Task Force in producing the Blueprint, they should have asked two more questions for each provision, “How does this provision affect the less wealthy?” and “How does this provision affect the most wealthy?”
Disparity of Incomes
The Blueprint completely ignores the disparity of incomes. The Blueprint makes no attempt to mitigate the disparity. The Blueprint ignores that extreme disparity of U.S. incomes has created a kind of aristocracy in the United States, with special favorable taxation and access to government officials not enjoyed by the less wealthy.
The Blueprint ostensibly intends to increase “growth”. It ignores that “From 1977 to 2007 three-fourths of the income growth in the U.S. economy went to the top 10% of households.”, per Lansing & Markowitz (2016).
“For households in the top 1 percent of the income distribution, inflation-adjusted after-tax income grew at an average rate of about 3 percent per year, making that income 192 percent higher in 2013 than it was in 1979 for those households. In contrast, households in the bottom quintile experienced an average growth of about 1 percent per year in their inflation-adjusted after-tax income over the same period, making that income 46 percent higher in 2013 than it was in 1979.” -- Congressional Budget Office, “The Distribution of Household Income and Federal Taxes, 2013” (Jun 8, 2016, https://www.cbo.gov/publication/51361)
The GOP tax reform proposal called the Blueprint will increase the aggregate after-tax household income share of the One Percent by redistributing federal revenues aggregating about 2% of total national household income, or about $150b per year.
It is unlikely to promote economic growth and employment growth. If we expect the Trump administration’s proposal for increased spending on security, military and infrastructure, then a tax cut like the Blueprint will produce increased fiscal deficit.
Given that the Blueprint ostensibly promises economic growth and employment growth, the most polite word I can find to describe it is “disingenuous”.
Daniel Brockman, "Income Inequities" (Jun 2010) https://daniel-brockman.blogspot.com/2010/06/income-inequities.html
I want to thank my good friends for the moral support, the thoughtful conversations and their reviews of prepublication drafts, all of which influenced and improved the content of this article.


